
Runs Lighthouse against a URL several times and shows the numbers side by side, so a single unlucky run does not get mistaken for a trend. Built for checking whether a change to a site actually made it faster.
Each run is throttled (simulated slow network, CPU slowdown) to keep results comparable between runs and between machines.
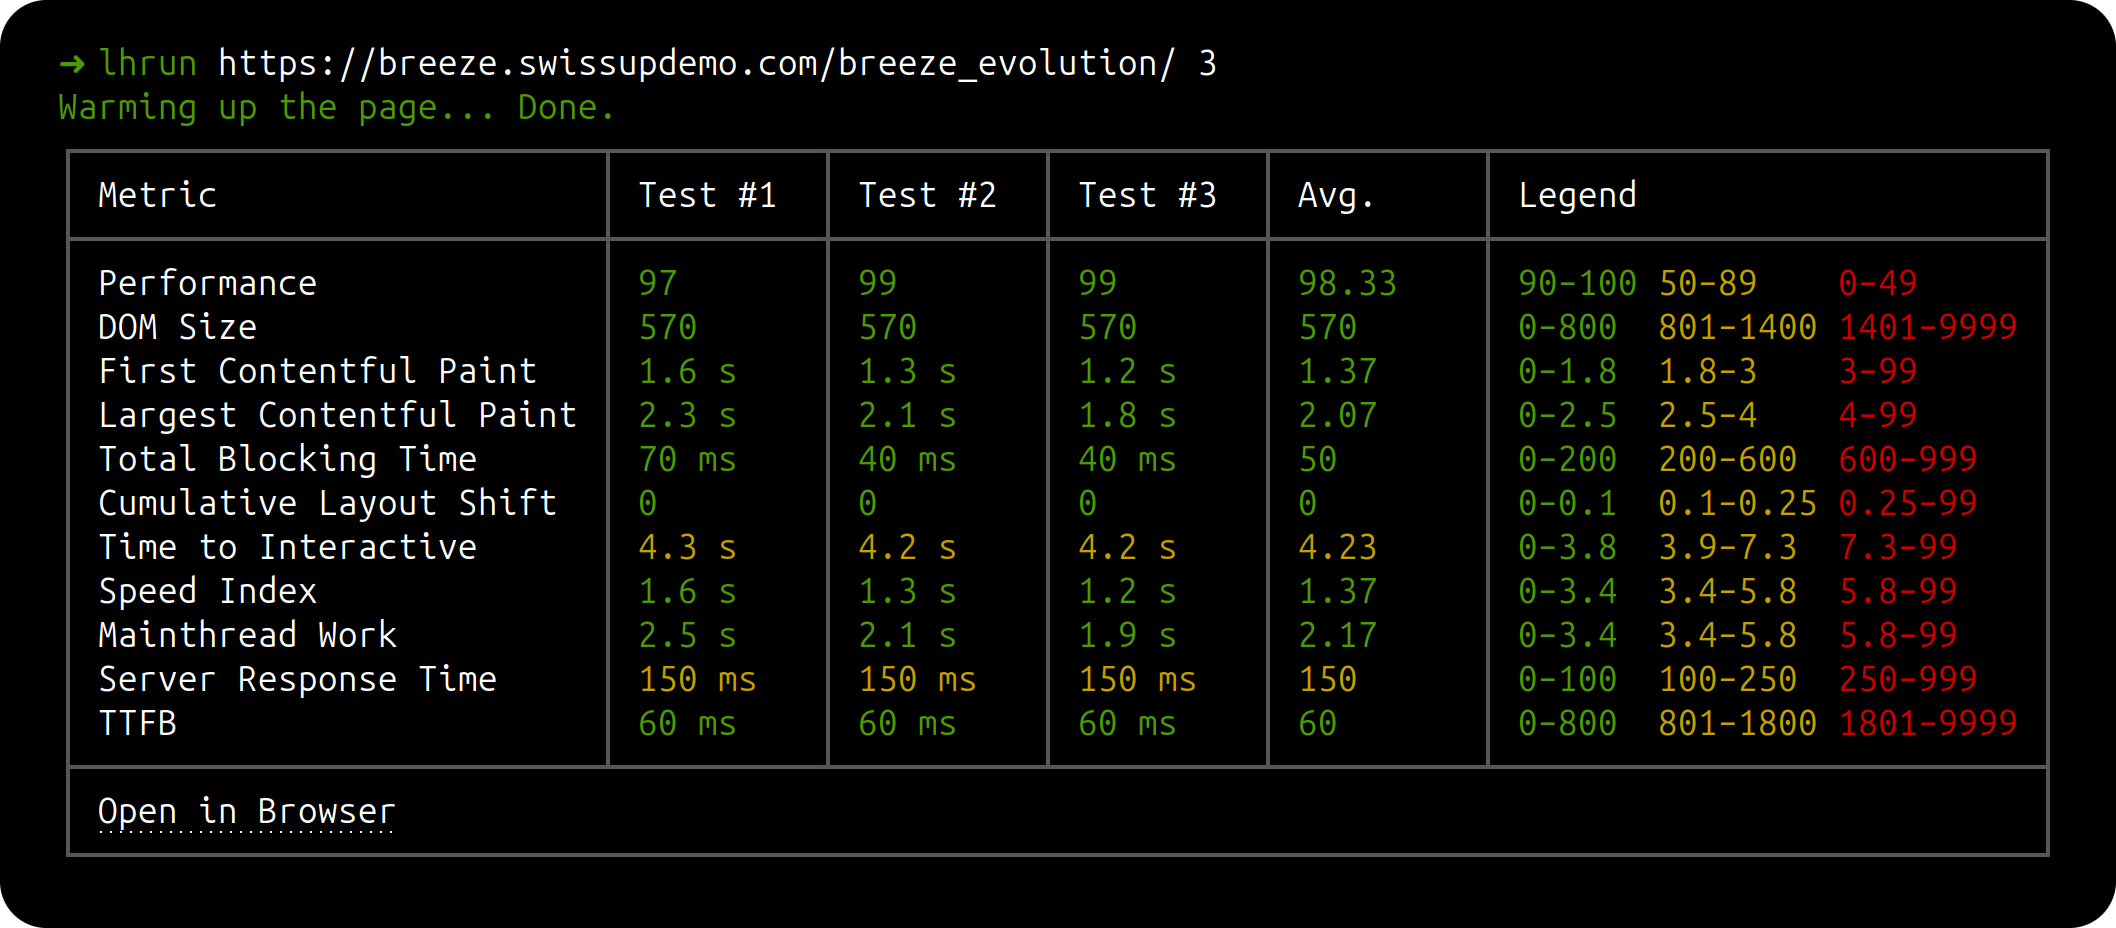
npm install -g lhrunThat puts an lhrun command on your PATH. Requires Node 22.19 or newer, which is what
Lighthouse 13 itself needs.
To run from a clone instead, npm install and then use node index.js in place of lhrun
below.
lhrun https://example.comYou can also compare current run with a previously saved results:
lhrun https://example.com --save=uniquename
lhrun https://example.com --diff=uniquename| Option | Default | What it does |
|---|---|---|
--save [name] |
off | Save the result when the run finishes, same as lhrun save [name] afterwards. |
--diff [name] |
off | Compare values with a saved result. Without a name, pick one from the list. |
--cpu <number> |
5.2 |
CPU slowdown multiplier. Lower it on a slow machine, raise it to exaggerate main-thread cost. |
--rand |
off | Give every run a unique ?rand= value, so each one is fetched past the full page cache. The warm-up still requests the plain URL, so PHP and the database stay primed. |
Without --rand you are measuring cached renders, which is usually what a visitor gets.
With it you are measuring the uncached path — on a Magento page behind full page cache the
difference in Server Response Time is easily an order of magnitude, so do not compare
numbers taken with the flag against numbers taken without it.
HTML reports always go to the same place, no matter where you run the command from:
~/.local/share/lhrun/reports (or $XDG_DATA_HOME/lhrun/reports if that is set). Each
report is one file per run, plus an index.html that shows them side by side. The index is
rewritten after every run, so it is readable while the tests are still going.
Remove them all with:
lhrun clearEverything measured lives in one array in src/audits.js. Add a row:
{
  title: 'Bootup Time',
  read: lhr => lhr.audits['bootup-time'].displayValue,
  good: [0, 2],
  ok: [2, 3.5],
  poor: [3.5, 99],
},readpulls the value out of a Lighthouse result. Write it plainly — it is called inside atry, and a throw or a missing value just marks that run as failed and retries it.good/ok/poorare inclusive ranges. They colour the value and are printed as the legend, so order them to match the metric — most are lower-is-better, butPerformanceruns the other way and needs no special flag.