

This is a 2-day hands-on mini project where you need to create a streamlit application for the Sakila database. This application must contain three pages:
- Home
- EDA
- Prediction
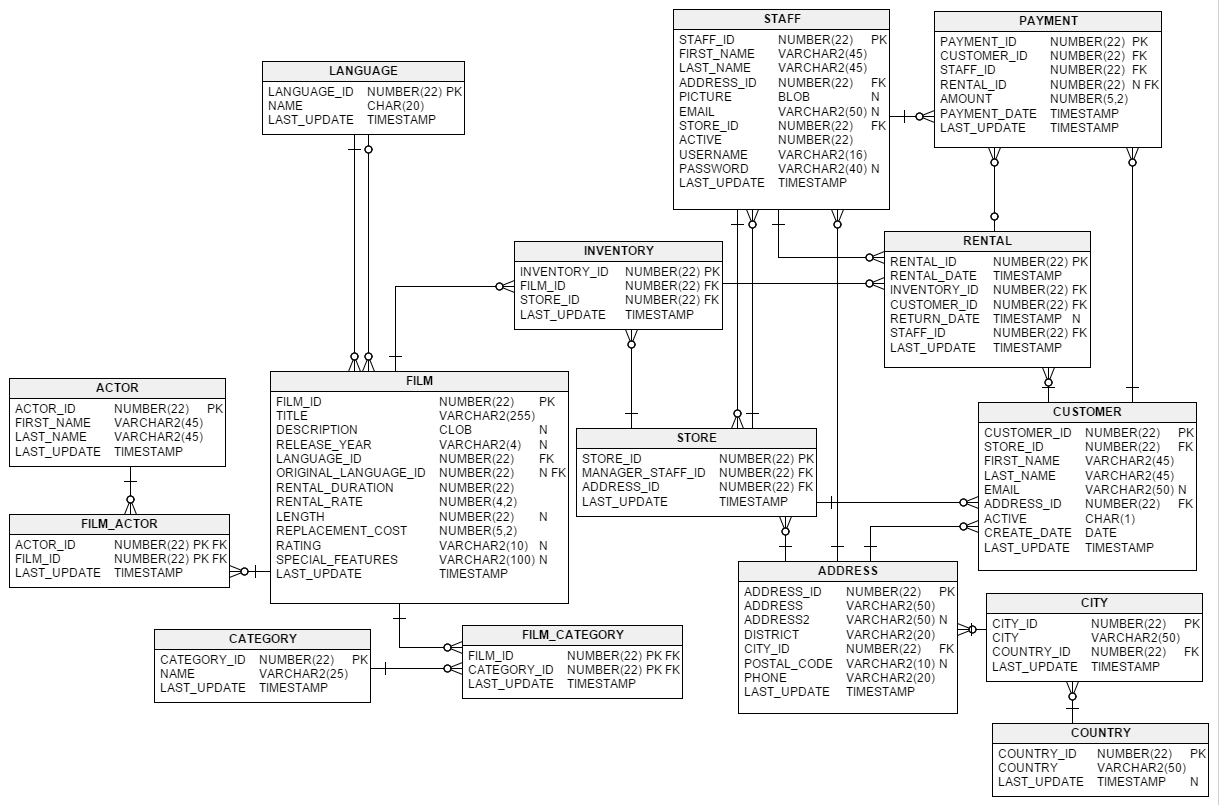
In this project, you will be using the Sakila database of movie rentals. You can follow the steps listed here to get the data locally: Sakila sample database - installation. You can work with two sql query files - sakila-schema.sql (creates the schema) + sakila-data.sql which inserts the data.
The ERD is pictured below - not all tables are shown, but many of the key fields you will be using are visible:
Must contain a title and an image of your choice.
Must contain the following plots:
- A line plot of daily rentals by each store in 2005
- A bar plot with the total benefit by each store
- A dataframe with the top five most rented movies by each store in 2005. Hint: use
st.dataframe(df)
Must contain a st.text_area() that will allow the user to input a movie description and get the top 3 most similar movies by description. Display the matches’ title and rating. It also must contain an st.button(“Get Your Prediction”) button. HINT: use the embedding model (Sentence Transformer) and the cosine similarity function.
Upon completion, add your deliverables to git. Then commit git and push your branch to the remote.