English · 简体中文
An MCP server for evidence-driven simulation debugging





TraceWeave is an MCP server for RTL / SoC debugging. It connects compile records, simulation logs, VCD/FSDB waveforms, and RTL source to your AI assistant, helping you work from a failed simulation to the relevant time, signals, and driving logic.
Use it with Claude Code, Codex, Copilot, or another MCP client. Describe the problem in natural language; the assistant uses tools to investigate, trace, and verify, with evidence you can review.
Use Cases · Installation · Client Setup · Start Debugging · Tool Quick Reference · FAQ · Documentation and Feedback
| Problem | How TraceWeave helps |
|---|---|
| A simulation times out or hangs, with no clear starting point | Summarize failures and scan interface handshakes to narrow down the affected interfaces and time window |
| A scoreboard mismatch or different results between runs | Compare failure records and waveforms, locate observed differences, and trace data and control sources on both sides |
| A signal becomes X/Z | Follow drivers and review waveform history to check whether a register sampled and retained an unknown value |
| Packed buses are hard to read, or TL-UL requests are not completing | Inspect address, data, and control fields individually, then check request/response handshakes, latency, and completion |
| Suspected ties, unconnected inputs, or magic-word conditions | Statically scan source code for constant connections, open inputs, and constant comparisons as investigation leads; no simulation run or waveform required |
| A deep SoC hierarchy with many modules and interfaces | Browse hierarchy on demand, locate instances and source files, and follow drivers, consumers, and connectivity paths |
| A debugging hypothesis needs evidence | Sample by cycle and check timing conditions, handshake stability, and transaction completion |
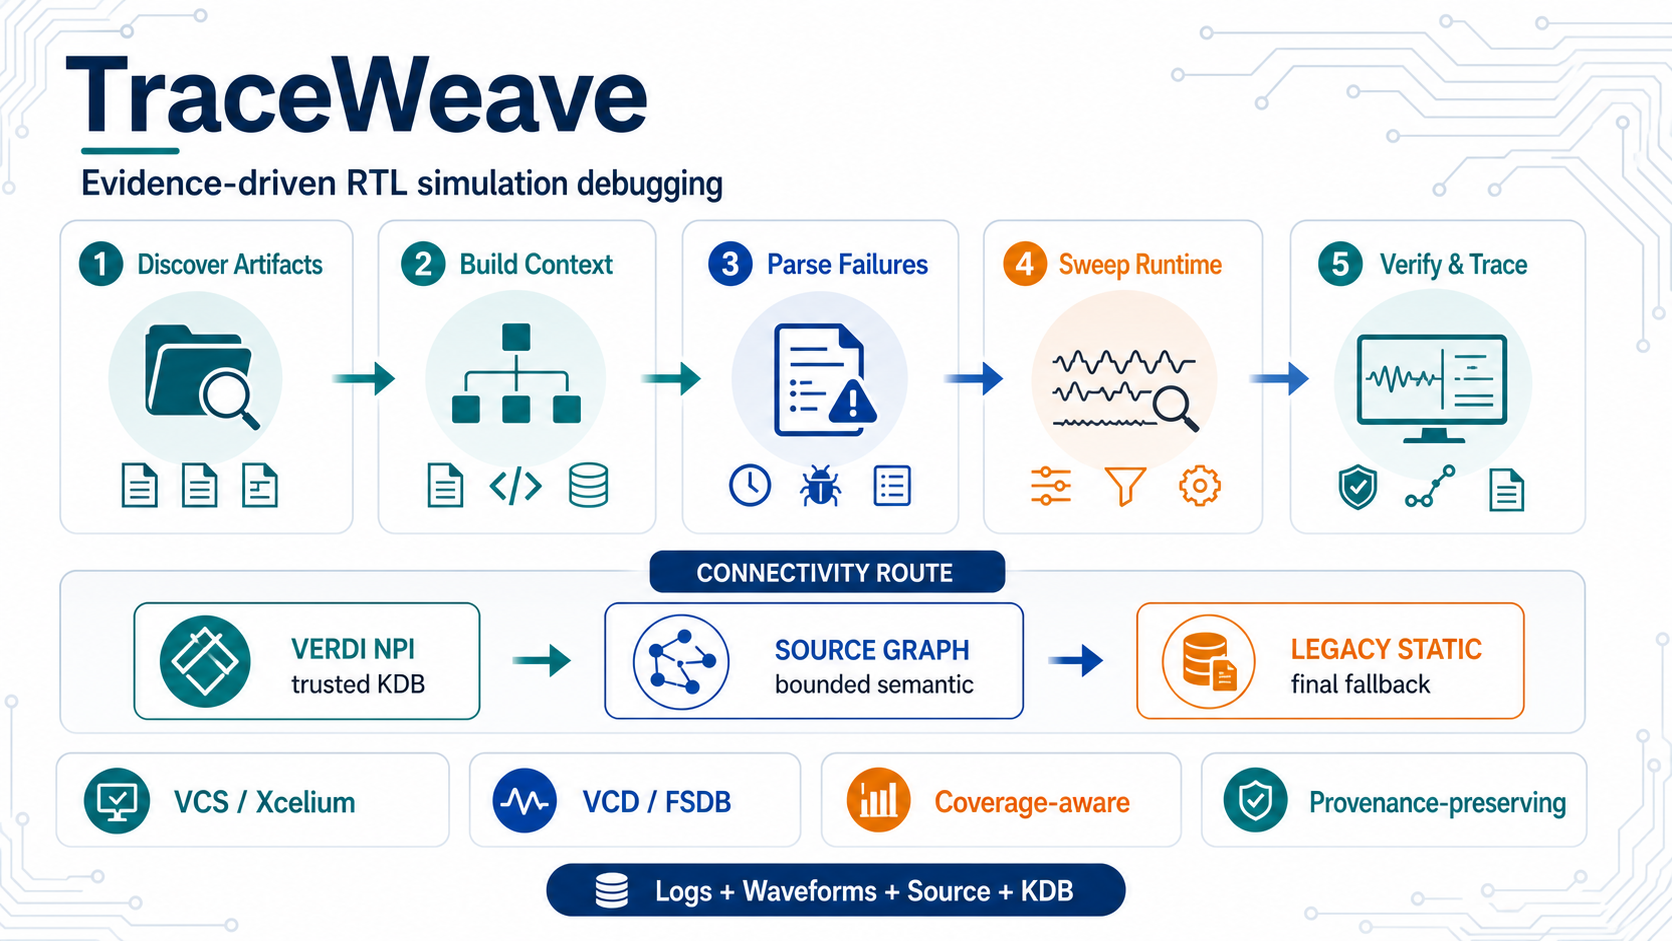
Supports VCS / Xcelium simulation logs and VCD / FSDB waveforms. Exported formal waveforms can also be queried; automatic artifact discovery currently supports JasperGold.
Signal tracing (driver, load, and connectivity path queries) follows Verdi NPI → Source Graph → basic static analysis (Legacy Static) by default. It first queries the elaborated KDB; when NPI is unavailable or cannot provide a trustworthy result, it tries Source Graph without a commercial license, then falls back to basic static analysis where supported.
Capabilities for large designs, with selected examples of validated scale:
- Hierarchy and source browsing on demand: the server builds and retains hierarchy and file indexes, then returns local results by instance, subtree, or file to keep large SoC queries manageable in the assistant's context. Hierarchy construction and local queries have been verified on a synthetic design with 50,500 logical instances; the initial build still scans compilation records and sources.
- Bulk handshake checks:
sweep_handshakesdiscovers AHB / valid-ready interfaces and checks stalls, payload stability, and premature valid/HTRANS deassertion. A recorded design with 78,817 total signals and a 2.59 ms waveform yielded 49 candidate interfaces involving 262 clock/protocol signals; 35 interfaces were checked in about 4.65 minutes, with 14 skipped and partial coverage. Runtime and coverage depend on the waveform, interface types, and resource limits. - GiB-scale log parsing:
parse_sim_loghas been verified on a 1 GiB synthetic log with 2,097,152 lines, finding all four errors at the beginning, middle, and end.
Requires Python 3.11+. Choose the installation that fits your environment:
| Installation | Intended use |
|---|---|
| Repository | Simulation hosts with an existing Verdi installation, for FSDB, Source Graph, and optional NPI / LSF |
| PyPI | Log and VCD analysis, or Source Graph without a commercial license |
git clone https://github.com/gokeshenzhen/TraceWeave.git
cd TraceWeave
export VERDI_HOME=/path/to/verdi
bash scripts/install.sh
The installer prepares the Python environment, Source Graph, and FSDB reader, then checks the runtime. It leaves shell startup files and MCP client configuration untouched. FSDB support builds against the Synopsys FSDB Reader SDK in VERDI_HOME; TraceWeave does not redistribute its headers or libraries. Use of the FSDB Reader is subject to the applicable VC Apps Access Program Agreement (or successor). NPI and KDB operations also require the appropriate EDA runtime and license from your site.
For an existing installation, start with a read-only check:
bash scripts/install.sh --checkpython3.11 -m pip install "traceweave-mcp[source-graph]"
traceweave-mcp --doctorFor logs, VCD, and basic static analysis only, install traceweave-mcp without [source-graph]. The PyPI package does not include the FSDB reader; use the repository installation for FSDB.
After a repository installation, generate a client configuration template with absolute paths:
| Client | Generate configuration template |
|---|---|
| Claude Code | bash scripts/install.sh --print-config claude |
| Codex | bash scripts/install.sh --print-config codex |
| Copilot | bash scripts/install.sh --print-config copilot |
These commands only print templates. Add the output to your client's MCP configuration, supply any required site EDA environment variables, and reconnect the server. See the client configuration reference for complete examples.
Other MCP clients supporting stdio can use these connection settings:
| Installation | command |
args |
|---|---|---|
| Repository | <absolute-repository-path>/.venv/bin/python |
["<absolute-repository-path>/server.py"] |
| PyPI | traceweave-mcp, or its absolute path |
[] |
If Verdi/NPI licenses are available only on LSF compute nodes, provide these settings to the MCP server process. Replace digital with your queue:
export TRACEWEAVE_NPI_EXECUTION=lsf
export TRACEWEAVE_NPI_LSF_QUEUE="digital"
The client must inherit or explicitly pass these variables. Project files, the TraceWeave installation, and cache directories must be visible at the same absolute paths on submission and compute nodes. See the LSF configuration reference for bash / tcsh examples, client environment forwarding, and verification steps.
Once connected, try a request like this, replacing the path with your project directory:
Use TraceWeave to investigate the simulation failure in
my_caseunder/path/to/verif. Start with the logs, design structure, and interface handshakes, then trace suspicious signals. Include timestamps, signals, and source references in your findings.
You can also start with a specific question:
Compare
tb.dut.resultin these two waveforms and trace the logic producing the difference on each side.
Use deep mode to scan the design described by this compile log for suspicious ties, unconnected inputs, and constant comparisons.
The assistant's default investigation follows these steps:
- Find the run's artifacts: locate compile logs, simulation logs, and waveforms.
- Establish design context: build the hierarchy and scan structural risks in parallel using the same compile log.
- Narrow the investigation: parse failures and scan handshakes for failed runs with a waveform.
- Trace and verify: inspect signals, drivers, and consumers, then test hypotheses with window or cycle checks.
- Compare after a fix: check how failure records and waveforms change in the next run.
For a first connection check, ask the assistant to call get_sim_paths and confirm that actual MCP tool calls run. See the debug workflow for the full procedure.
For a repository readback check without an EDA license, run
.venv/bin/python scripts/check_waveform_readback.py --work-dir /tmp/traceweave-readback-check.
It checks the server catalog and actual point/batch values through MCP, and
prints explicit requests for a separate AI-client smoke session. Server checks
leave AI-client visibility and model adoption unverified; see the
readback check procedure.
When two simulation runs produce different results, TraceWeave can compare selected signals, locate the earliest difference it can confirm within a time window, and trace the related data, control, and RTL logic on both sides.
For X/Z, inspect the propagation path at the time of interest or look back through history to check whether a register sampled an unknown value and continued to hold it. You can investigate earlier events even if the input is now known:
tb.dut.qis X at 36 ns, but its input is now known. Review the waveform from 0 to 36 ns, check earlier sampling and hold behavior, and trace possible sources.
Results distinguish relationships supported by evidence from leads that need more investigation. When history is missing or a structure is unsupported, TraceWeave explains where tracing stopped. The first recorded anomaly is not automatically its true point of origin.
See waveform comparison and X/Z history tracing for tool parameters and detailed support limits.
Existing waveform tools accept explicit { "expr": "a[b] + c", ... } inputs. Expressions use SV precedence, widths, signedness and four-state values; indices are sampled again at each observation. Point, cycle, transition, window, handshake, transaction and TL-UL queries share this core with RTL backtracing. No additional MCP tool is required.
Use exact bindings and explicit types, or choose typing: "wave_bits" for an unsigned four-state view of dumped vectors. Fixed arrays use bounded element mappings; reading a formula does not replace the recorded output signal. See expression inputs, examples and limits.
When address, data, and control information share a packed bus, TraceWeave can identify field positions from source types that match the waveform. The assistant can then inspect individual fields, reducing manual work to look up widths and calculate offsets. You can also provide a field-to-bit mapping when automatic resolution is unavailable.
For TL-UL interfaces, once the assistant confirms the field mapping and clock, it can check handshake stalls, request/response matching, response latency, and outstanding requests within a specified time window:
Check the TL-UL interface under
tb.dutfrom 10 to 20 μs for handshake stalls or outstanding requests. List the relevant times and signals.
Results state which checks ran and what information is missing. A request still outstanding at the end of the window is not automatically a deadlock, and these checks do not replace full TL-UL protocol verification.
For a long debugging conversation, ask for compact evidence output. Repeated field mappings are shown once, while checked scope, missing evidence, time boundaries and next steps remain available. Existing clients keep their usual output by default. See compact evidence output for examples and client integration.
See bus fields and TL-UL for field configuration and detailed support limits.
parse_sim_log already recognizes standard UVM_ERROR / UVM_FATAL messages and VCS / Xcelium assertion failures, with a generic ERROR fallback. For project-specific checker, scoreboard, or $display output, add Python regular expressions to custom_patterns.yaml. Custom messages do not need to contain UVM_ERROR or even ERROR; no Python changes are required.
If your messages share a label but the text after it varies, matching that label is enough:
MY_CHECK_FAIL @ 12.5 ns expected=0x12 actual=0x34
MY_CHECK_FAIL @ 20 ns timeout waiting for response
Replace the default patterns: [] with the following, or append the rule to your existing patterns list:
patterns:
  - name: my_checker
    severity: ERROR
    regex: '^MY_CHECK_FAIL'
^ means the start of the line; everything after the label may vary, with no extra regex needed. If a timestamp or other text precedes the label, use regex: 'MY_CHECK_FAIL' to match it anywhere in the line.
nameidentifies the failure group.severitydefaults toERROR;FATALandWARNINGare also supported. Matched custom warnings are included in runtime failure counts.descriptionis for maintainers.regexmatches one log line at a time. Use YAML single quotes to preserve backslashes. Built-in assertion and UVM parsing runs first, followed by custom rules in list order (first match wins), then the genericERRORfallback. Recognized compile / elaboration diagnostics remain excluded.
The expected=0x12 actual=0x34 format above is already recognized automatically, so the simple label rule is enough and no named captures are needed. Suppose your log uses its own field names instead:
MY_CHECK_FAIL @ 12.5 ns want=0x12 have=0x34
regex: '^MY_CHECK_FAIL' still recognizes the error and preserves the full message. To also extract want and have as the expected and actual values, replace the regex in the rule above with:
regex: '^MY_CHECK_FAIL.*want=(?P<expected>\S+)\s+have=(?P<actual>\S+)'Repository installations use the root custom_patterns.yaml by default. To keep project rules elsewhere, or when using the PyPI installation, save the YAML above in your own file and pass its absolute path to the MCP server process:
export TRACEWEAVE_CUSTOM_PATTERNS_FILE="/absolute/path/to/custom_patterns.yaml"This selects that file instead of the default custom rules; built-in formats remain active. The MCP client must inherit or explicitly forward the variable. Restart or reconnect the server after changing it, then parse the log again. Edits to the selected YAML are loaded on the next parse_sim_log call.
Usually, you describe the debugging goal and let the assistant select the tools. This table lists every tool by purpose; MCP tool definitions provide the parameters.
| Category | Tool | Description |
|---|---|---|
| Session and artifacts | get_sim_paths |
Find simulation cases, compile logs, runtime logs, and waveforms |
get_formal_paths |
Find formal projects, logs, and exported waveforms; currently supports JasperGold | |
get_diagnostic_snapshot |
Review collected debugging information and outstanding steps | |
| Hierarchy and source | build_tb_hierarchy |
Build an RTL / testbench hierarchy view from compile records |
get_tb_subtree |
Browse a selected instance's local hierarchy | |
find_tb_instance |
Find instances by path or module name | |
lookup_tb_files |
Find source files in the actual compiled file set | |
get_tb_file_detail |
Inspect modules, interfaces, and classes defined in a source file | |
get_tb_class_hierarchy |
Browse UVM / SystemVerilog class inheritance | |
dump_tb_section |
Retrieve a complete section of hierarchy analysis data | |
| Logs and failures | parse_sim_log |
Group runtime failures and extract timestamps and error summaries |
get_error_context |
Read the original log around an error | |
diff_sim_failure_results |
Compare new, persistent, and resolved failures between runs | |
analyze_failures |
Combine log and waveform context for a failure group | |
analyze_failure_event |
Identify candidate instances, signals, and source files for one failure | |
recommend_failure_debug_next_steps |
Recommend investigation targets and follow-up tool calls | |
| Static structural scanning | scan_structural_risks |
Statically scan source code for suspicious structures; semantic mode checks ties, open inputs, and constant comparisons |
| Signal tracing | explain_signal_driver |
Trace a signal's driver and relevant RTL |
find_signal_loads |
Find a signal's consumers and potential impact | |
trace_signal_path |
Query structural connectivity between two signals | |
trace_x_source |
Trace X/Z propagation and inspect historical register sampling and hold behavior | |
| Waveform queries | get_waveform_summary |
Inspect waveform format, duration, timescale, and top modules |
search_signals |
Find full signal paths by name | |
get_signal_at_time |
Read a signal's value at a specific time | |
get_signal_transitions |
Inspect signal transitions within a time window | |
get_signals_around_time |
Inspect multiple signals around a selected time | |
get_signals_by_cycle |
Sample multiple signals on clock edges | |
| Differences and timing | diff_first_divergence |
Find the first observed known-value difference between two signals |
trace_divergence |
Verify a waveform difference and trace relevant data, control, and prior state on both sides | |
period |
Check signal periods and cadence anomalies | |
verify_window |
Verify temporal conditions within a waveform window and return concrete evidence | |
| Protocols and transactions | suggest_handshakes |
Discover valid/ready interfaces and signal bundles for inspection |
suggest_protocol_bundles |
Discover AHB / APB interface signal bundles | |
sweep_handshakes |
Scan discovered valid/ready and AHB interfaces across the design and summarize anomalies | |
inspect_handshake |
Check one interface for stalls, stability, and handshake anomalies | |
reconstruct_transactions |
Reconstruct requests and responses to inspect latency, outstanding requests, and ordering | |
resolve_packed_fields |
Identify packed bus fields to inspect address, data, and control signals individually | |
inspect_tlul |
Check TL-UL requests and responses for handshake stalls, response latency, and outstanding requests | |
| Time cursors | cursor_set |
Name a key timestamp for reuse in later queries |
cursor_list |
List time cursors in the current session | |
cursor_delete |
Remove a time cursor | |
| EDA integration | build_kdb |
Build and cache a Verdi KDB from compile records for NPI queries |
Can I use TraceWeave without a commercial license?
Log analysis, VCD queries, static structural scanning, and Source Graph do not need a commercial license. Direct value and transition queries on existing waveforms do not need an NPI license: VCD uses the built-in parser, while FSDB uses the local Verdi FSDB Reader and remains subject to its agreement described above. Verdi NPI signal tracing and KDB builds require the corresponding EDA environment and license.
Can missing path variables be recovered automatically?
Yes. You can use a CLI agent in a terminal where the project's setup script has not been sourced, or give it logs and waveforms from a run launched in another terminal. TraceWeave can recover compilation input path variables from VCS compile logs and filelists when their values can be determined unambiguously, enabling hierarchy analysis, KDB builds, and Source Graph queries.
Recovery covers compilation input paths; the corresponding source and include files must remain accessible. The runtime prerequisites must already be available: VERDI_HOME, installed EDA tools, and license configuration for KDB builds, plus Python and pyslang dependencies for Source Graph.
How should I judge signal-tracing accuracy?
NPI uses an elaborated KDB matching the current design; Source Graph builds a semantic connectivity graph from source. With complete compilation context, supported target semantics, and complete query coverage, exact resolution, and no truncation, the results can be treated as exact structural connectivity facts within the current query scope for driver, load, and connectivity path analysis.
Can I run static structural scans without simulation results?
Yes. scan_structural_risks performs static source analysis without running a simulation or reading simulation run logs or VCD / FSDB waveforms. The current interface requires a compile/elaboration log (compile_log) and access to the corresponding sources and include files, so it can be used after compilation/elaboration, before running the simulation.
How do I choose auto or deep for static structural scanning?
The default auto mode runs source-text checks and reuses compatible semantic results already available. Ask the assistant to use deep when you need a new semantic scan for constant connections, open inputs, and similar facts. The analysis_mode parameter applies to each call; no client configuration change is needed. Findings are leads to investigate: legitimate tie-offs and protocol constants may also appear.
Does a scan with no findings mean the design is correct?
Conclusions depend on actual coverage. Missing signals, resource limits, or unsupported structures can limit analysis. Zero findings with zero or partial coverage do not establish that a design is free of problems. Tools report coverage and truncation so the assistant can decide whether to narrow the scope and investigate further.
Can I inspect formal waveforms?
You can query exported VCD / FSDB files and automatically discover JasperGold artifacts. Property results, trace classification, and reachability semantics must come from the formal tool or the user.
Standalone exports do not require a recognized formal project. When discovery finds waveforms without project entries, get_formal_paths includes a short hint for the existing point and batch readers; the caller selects the waveform, signals, and timestamp.
Where is design data processed?
File parsing and EDA queries run locally or on the configured LSF compute nodes. Returned debugging evidence enters your AI client's context. TraceWeave usage telemetry is off by default and writes only to local files when enabled.
| Learn more about | Resource |
|---|---|
| Debugging steps and tool cooperation | Debug workflow |
| Verifying a root cause with evidence | Debug discipline |
| Architecture, backend capabilities, and resource limits | Architecture |
| Complete environment configuration and advanced settings | Configuration reference |
| Reporting a problem or suggesting a feature | GitHub Issues |
Before contributing, read AGENTS.md. With test dependencies installed, run python3.11 -m pytest from the repository root.
TraceWeave is available under the MIT License.
Follow the WeChat public account for project updates and debugging examples: